Preparing the landing page

Before officially launching the landing page, we made a series of changes that will be described below:

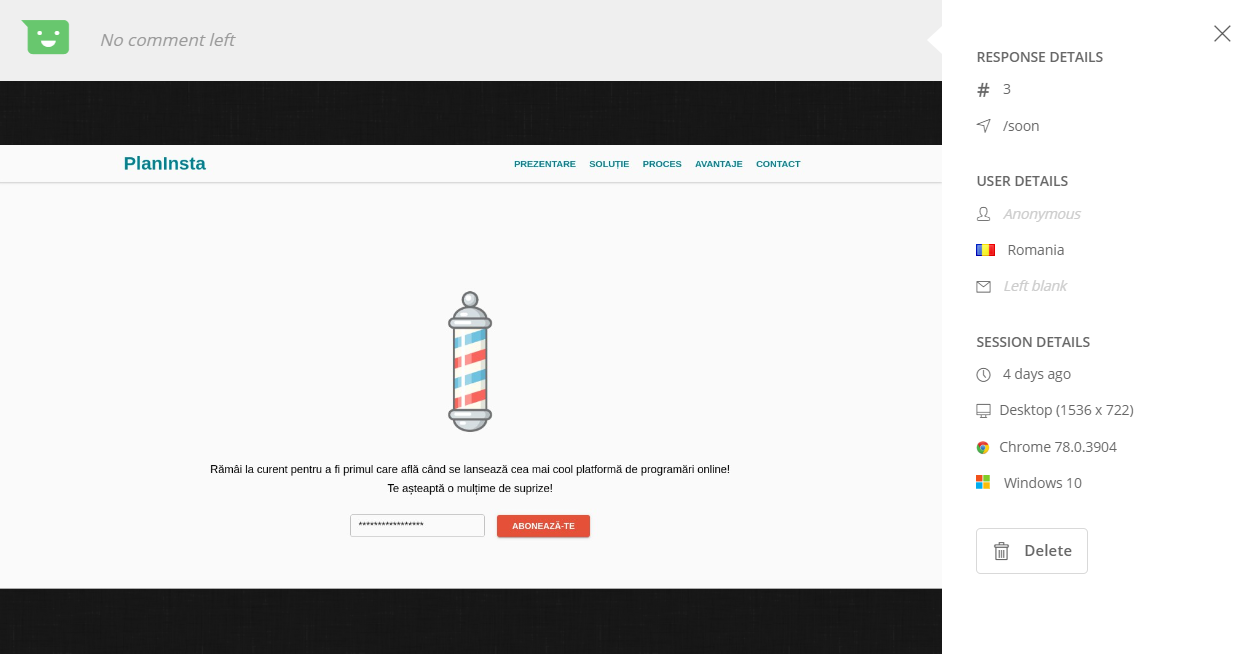
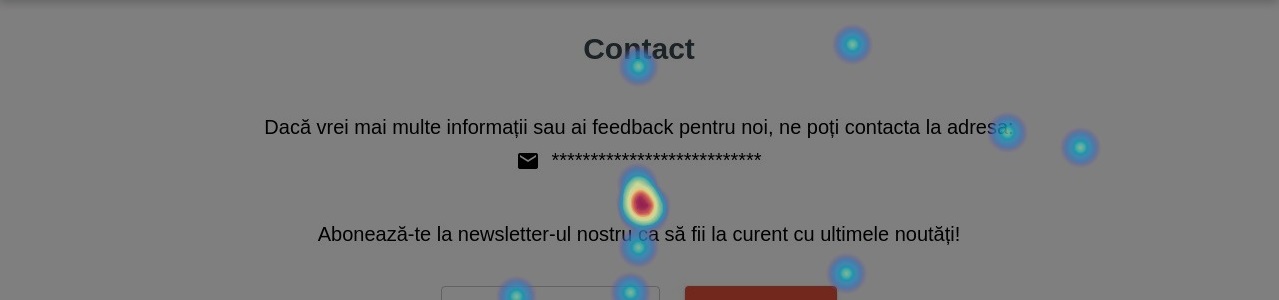
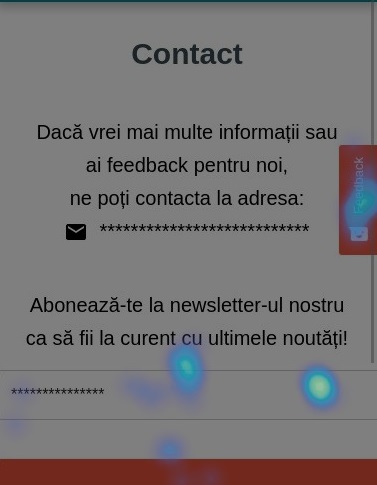
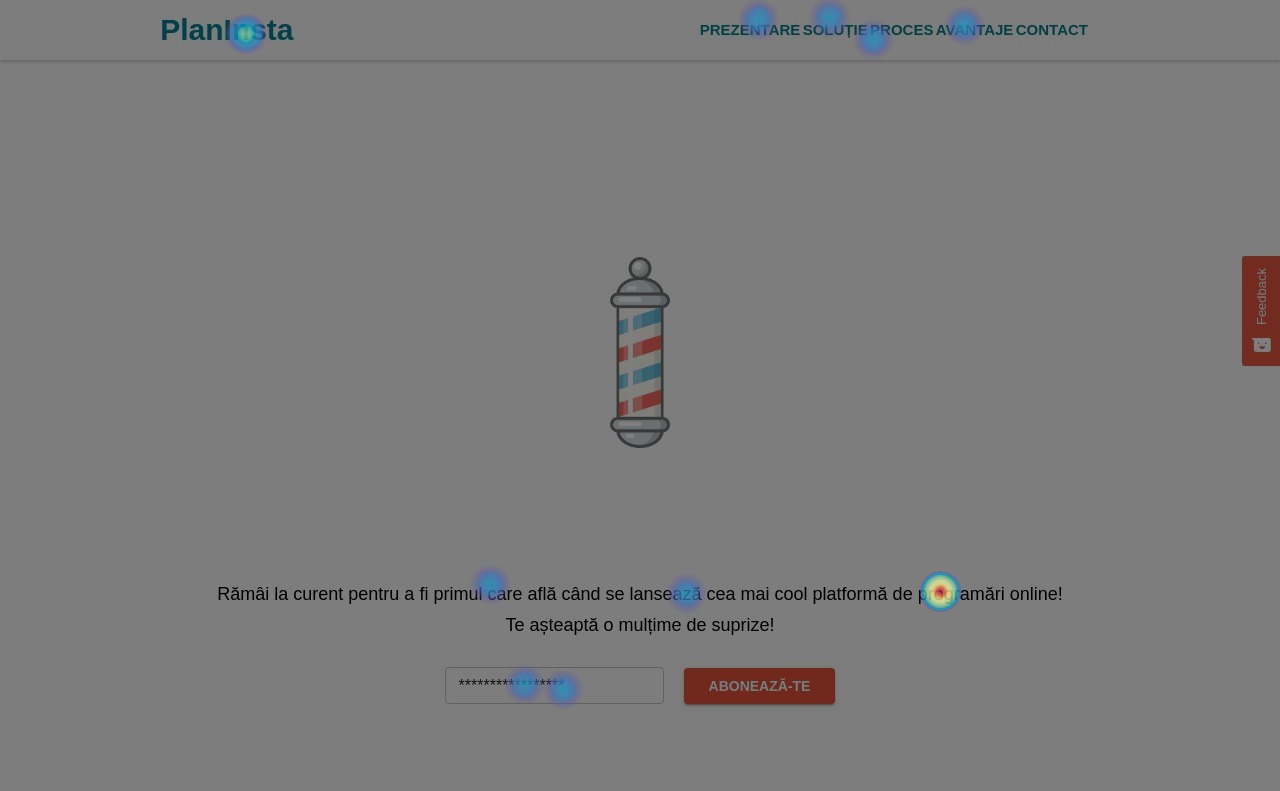
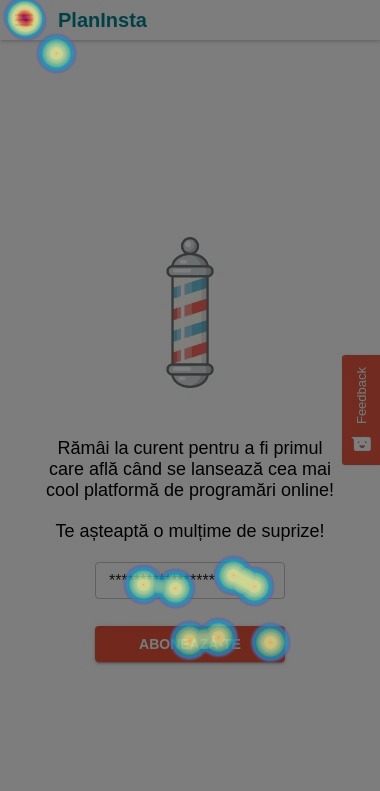
  • We updated the subscribe section, as in the previous milestone this wasn't collecting any e-mail addresses.
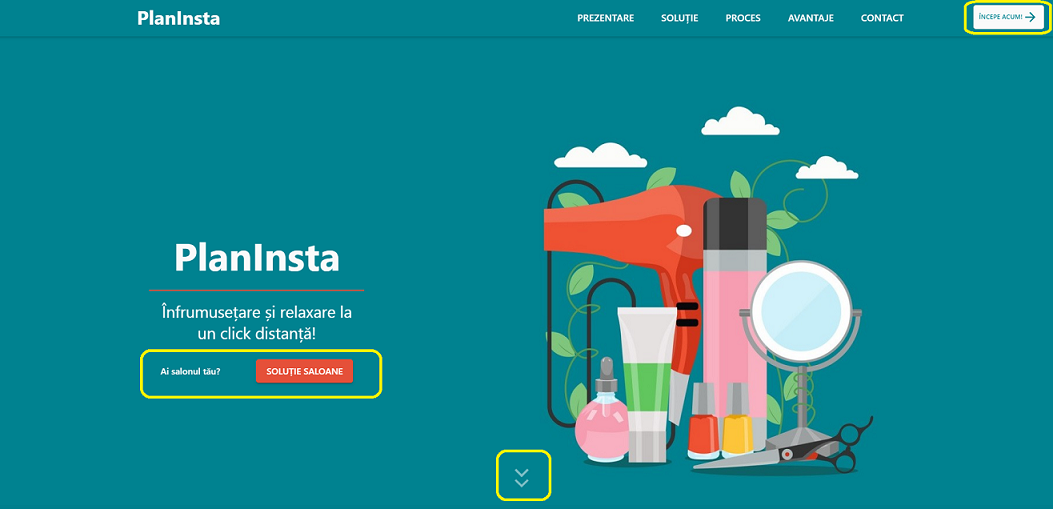
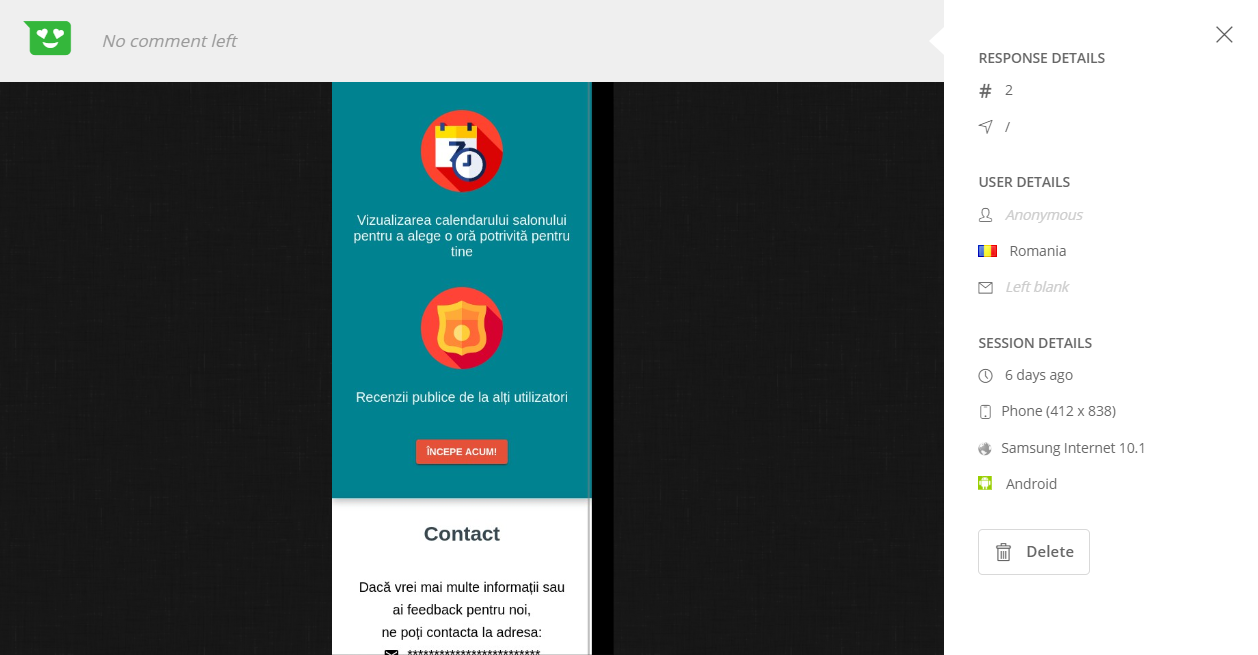
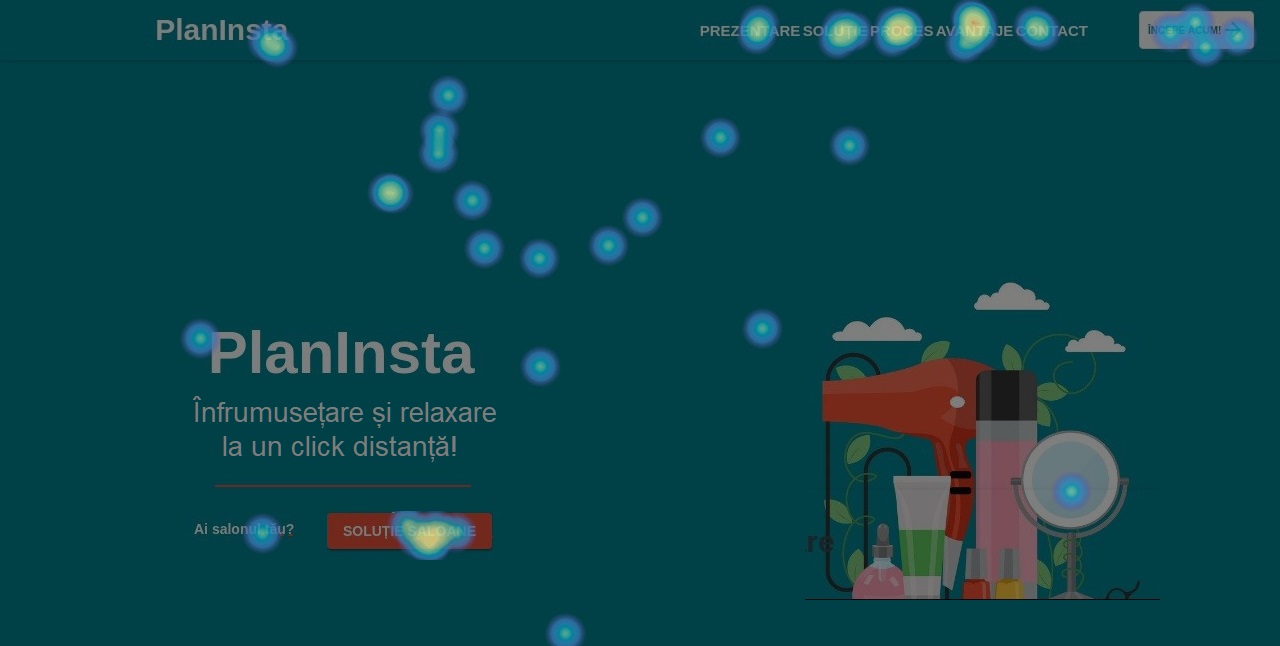
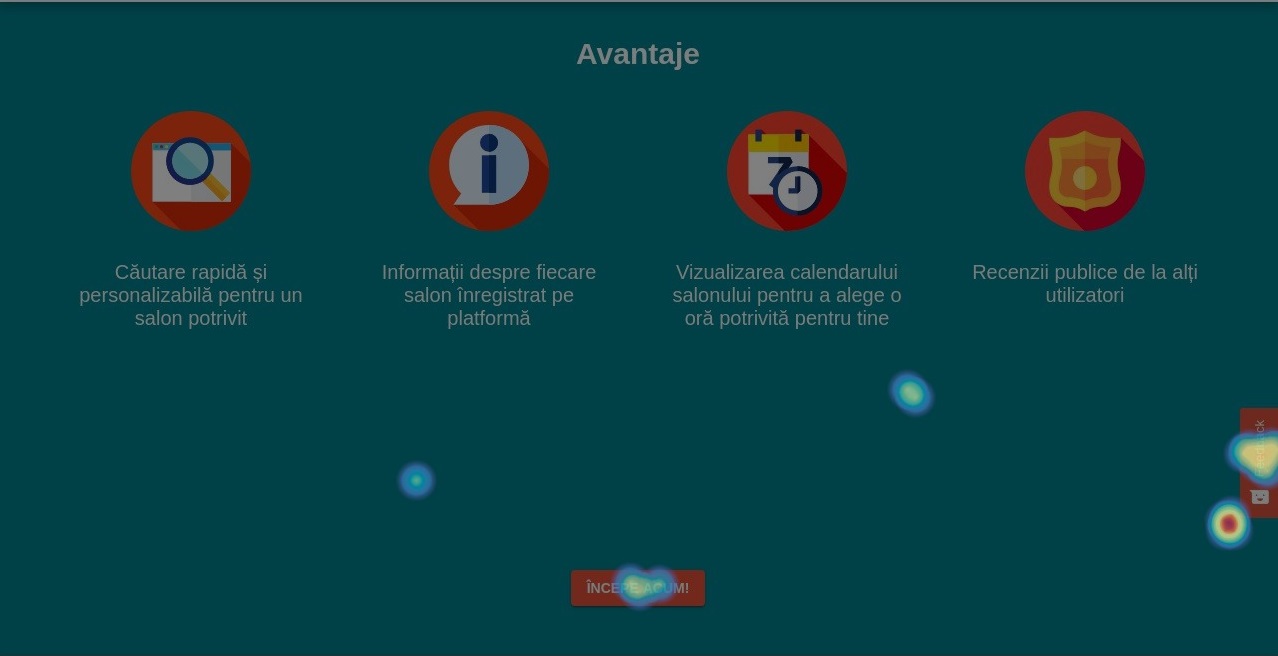
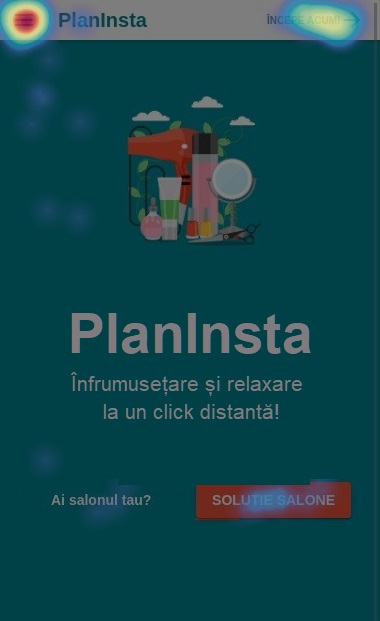
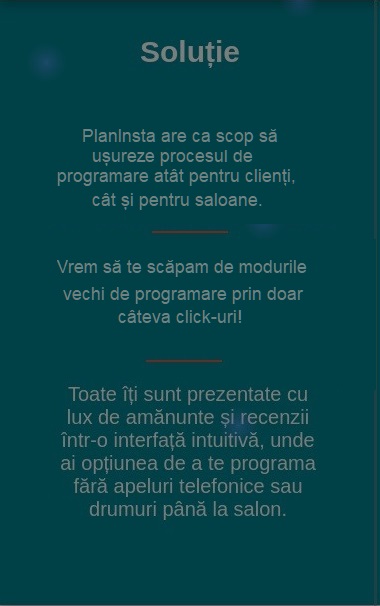
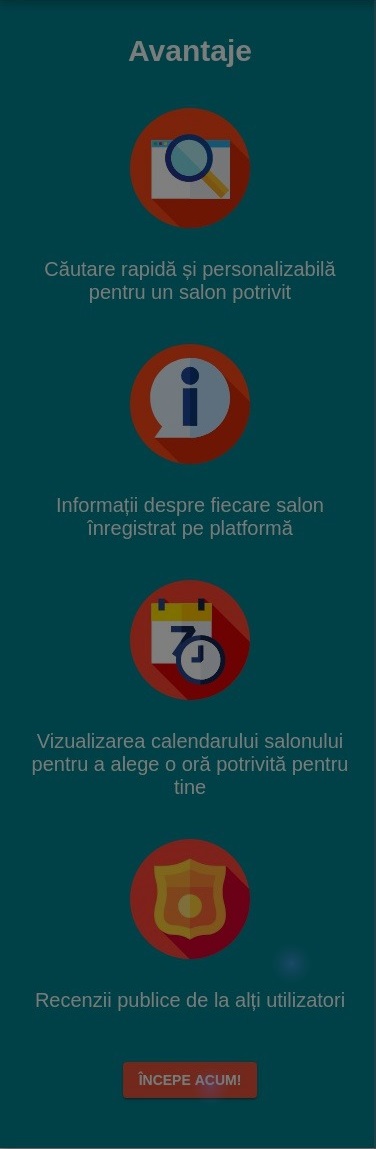
  • We realized that the call-to-action "Start now" button was not very visible:
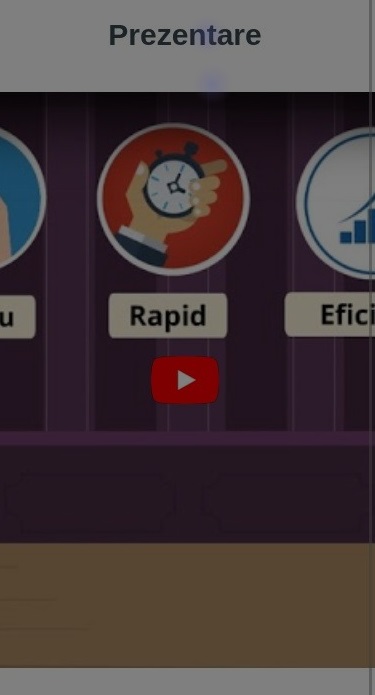
    the visitors of our page had to scroll to the bottom of the page to notice it, so we decided to add this button to the first section too
  • To make it clear that there is more content on the page, we added some arrows hinting to the user there is more to scroll down to
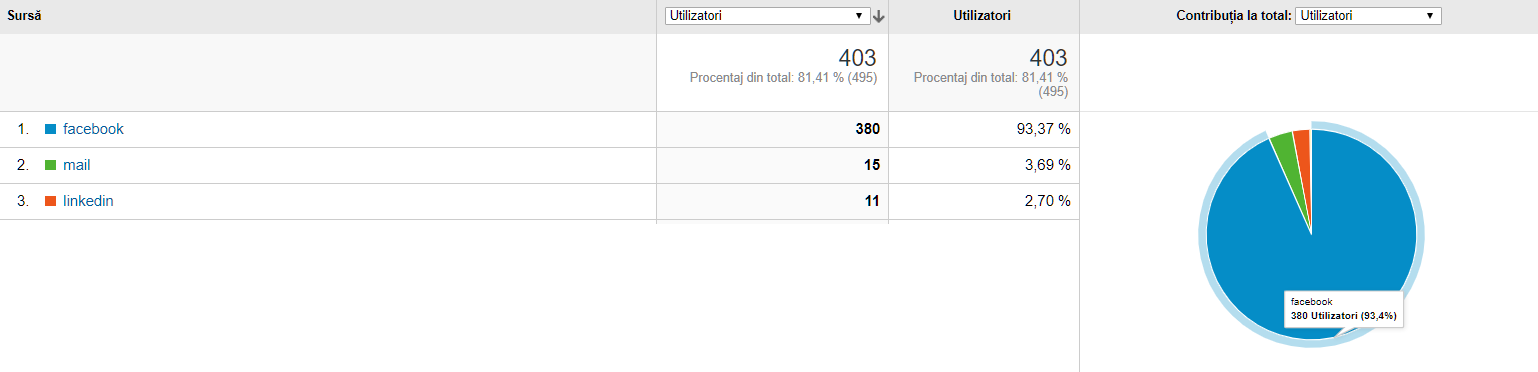
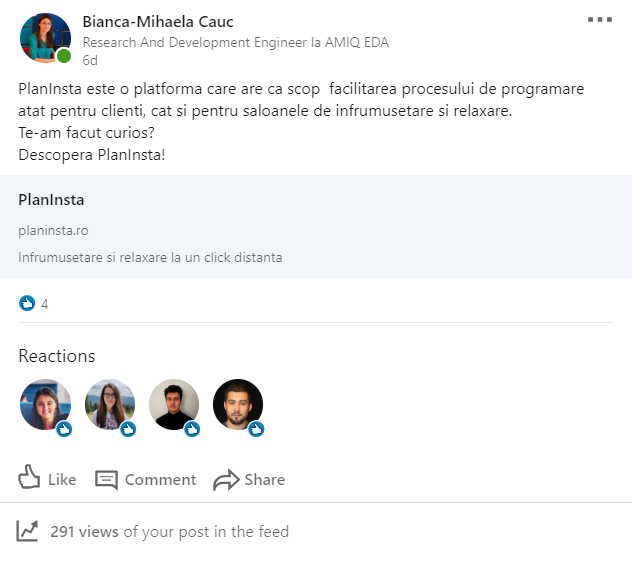
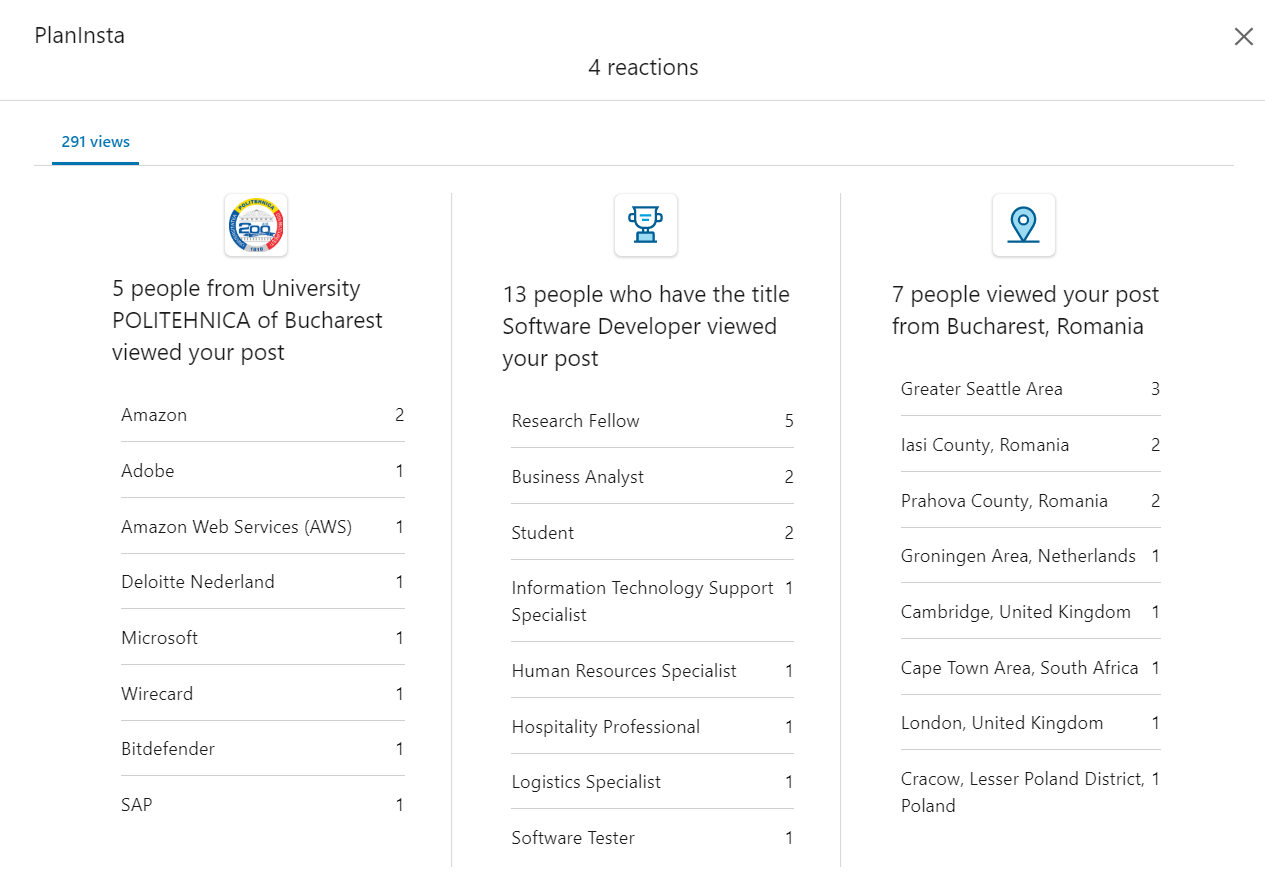
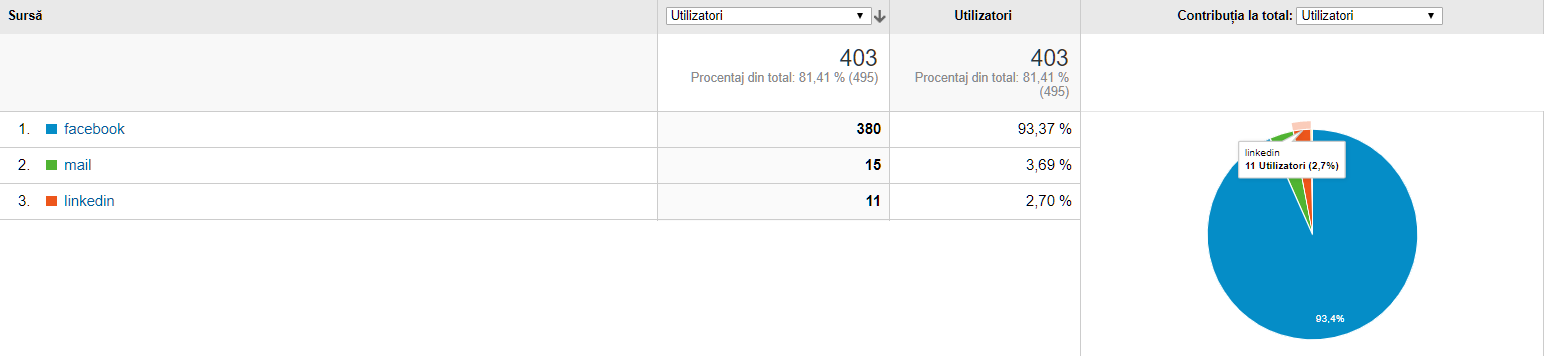
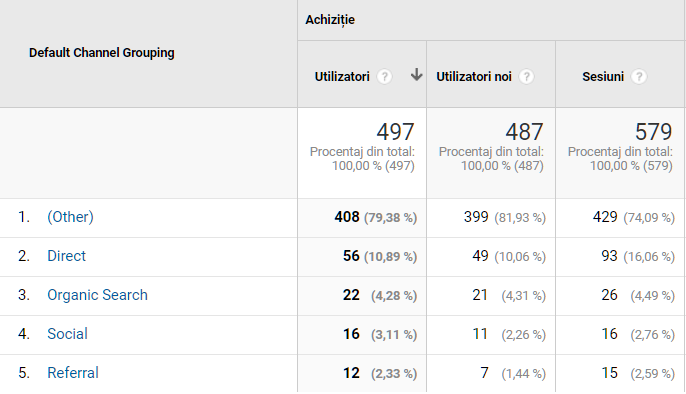
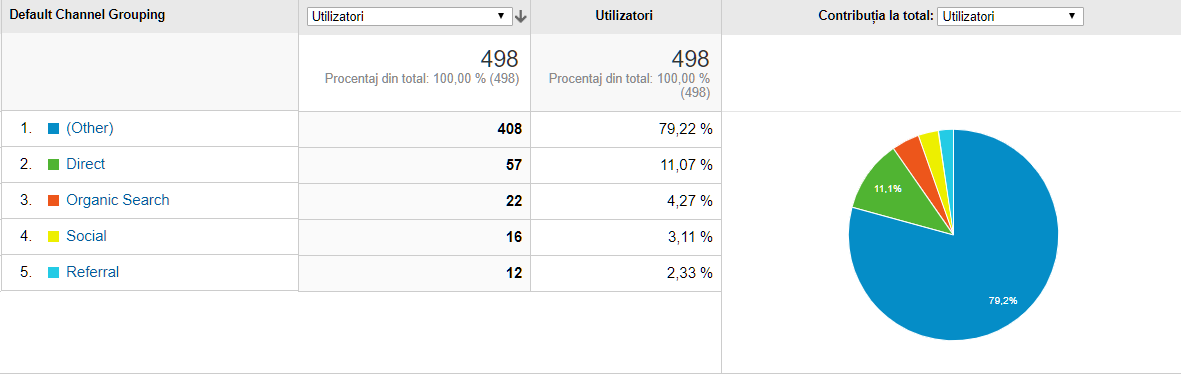
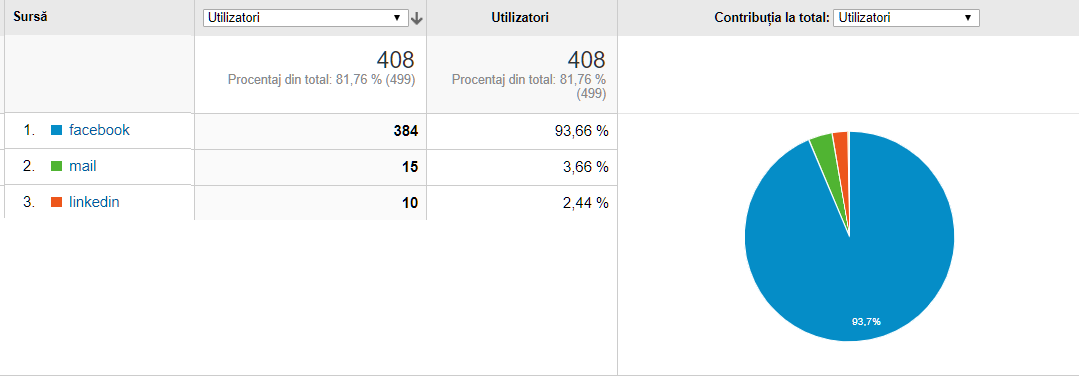
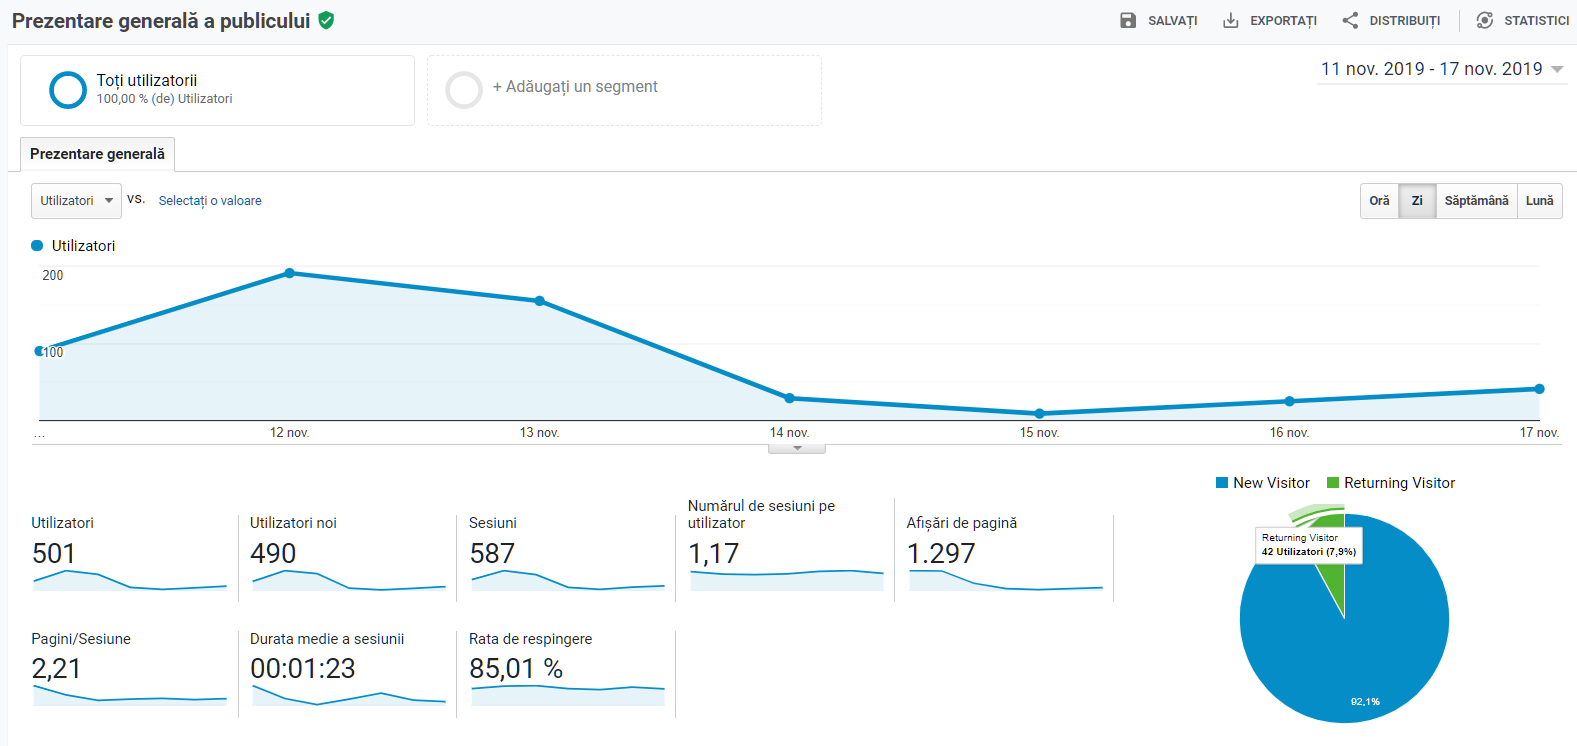
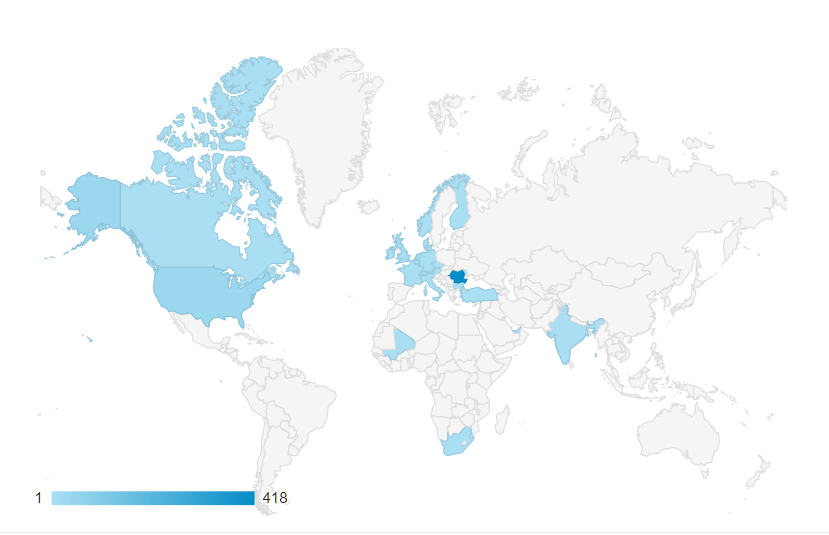
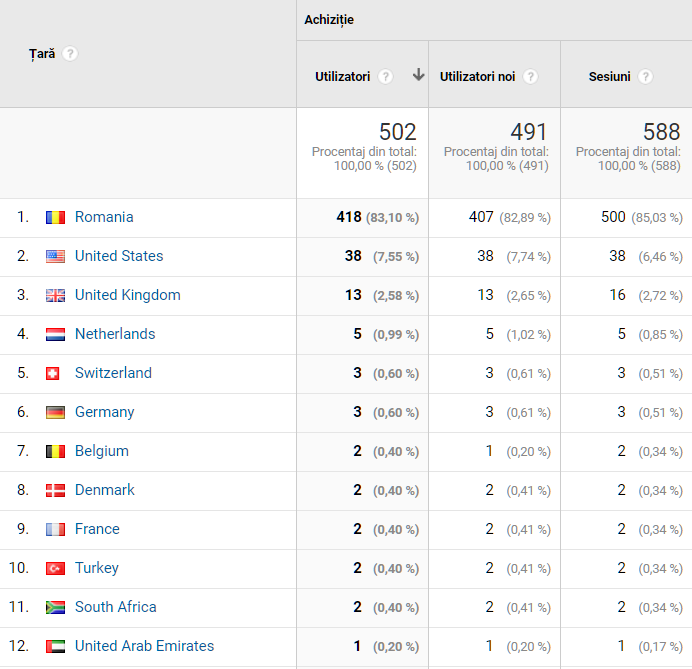
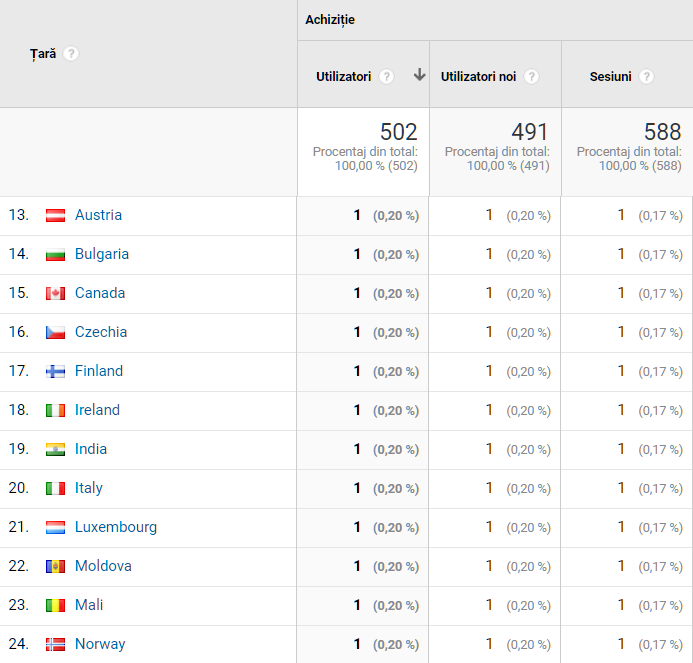
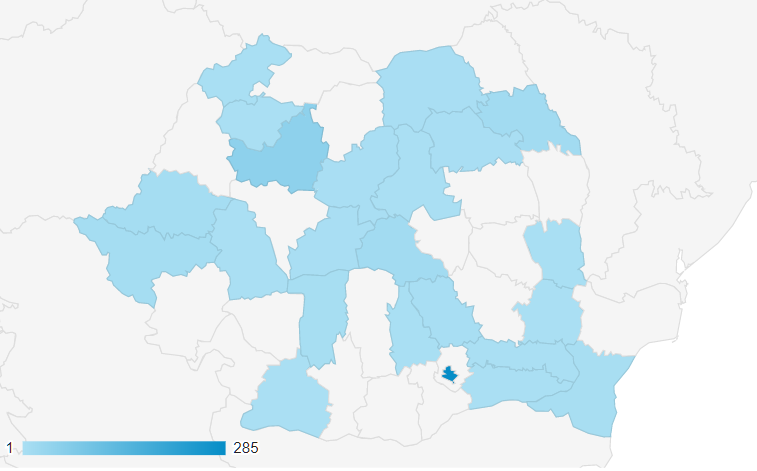
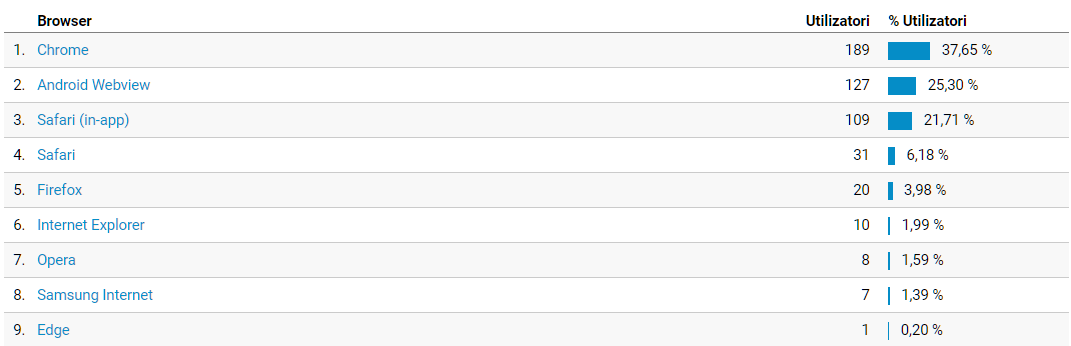
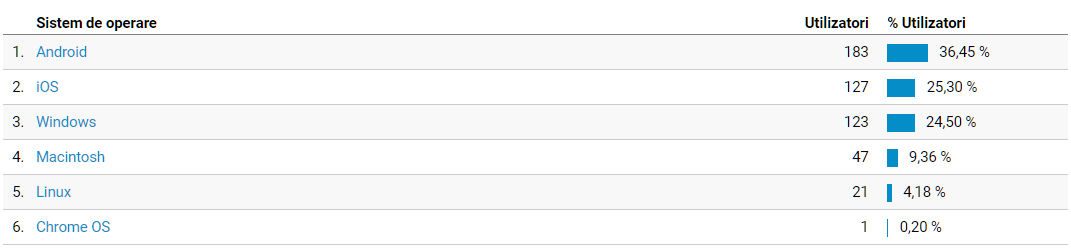
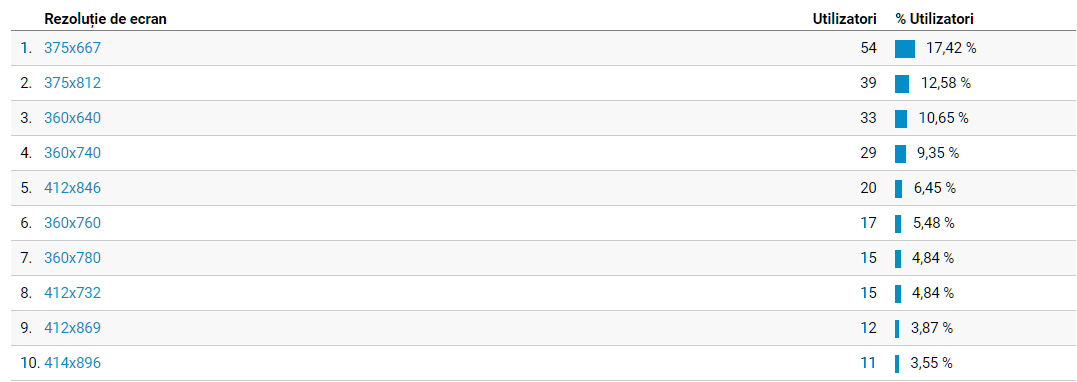
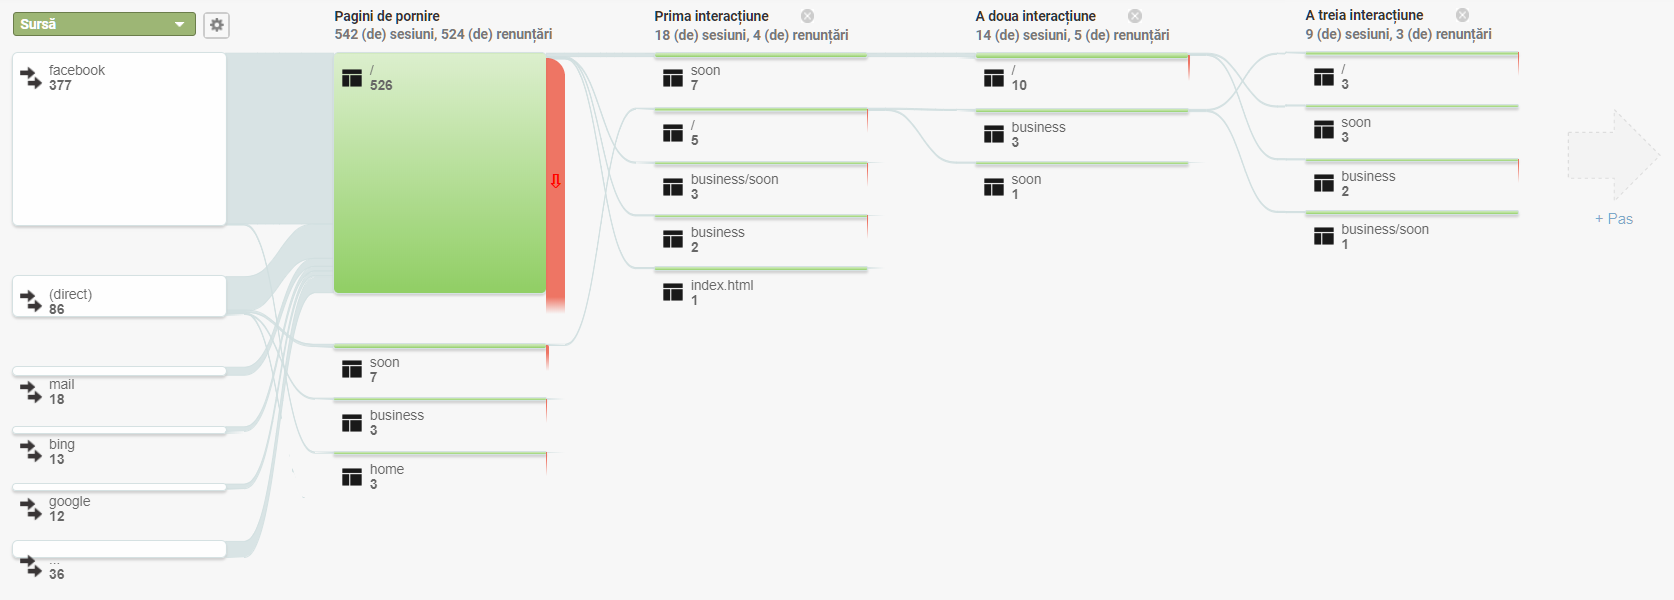
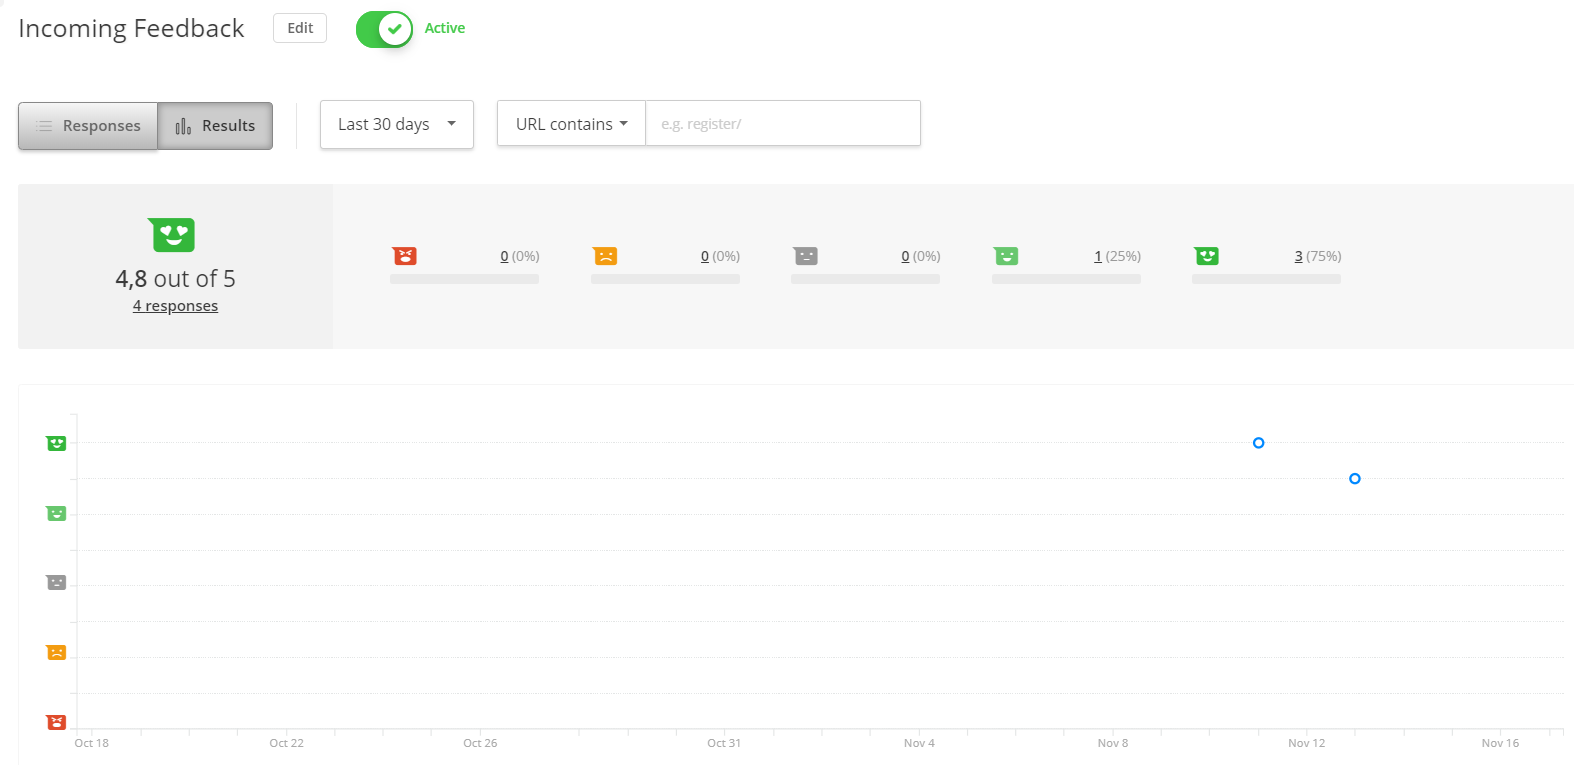
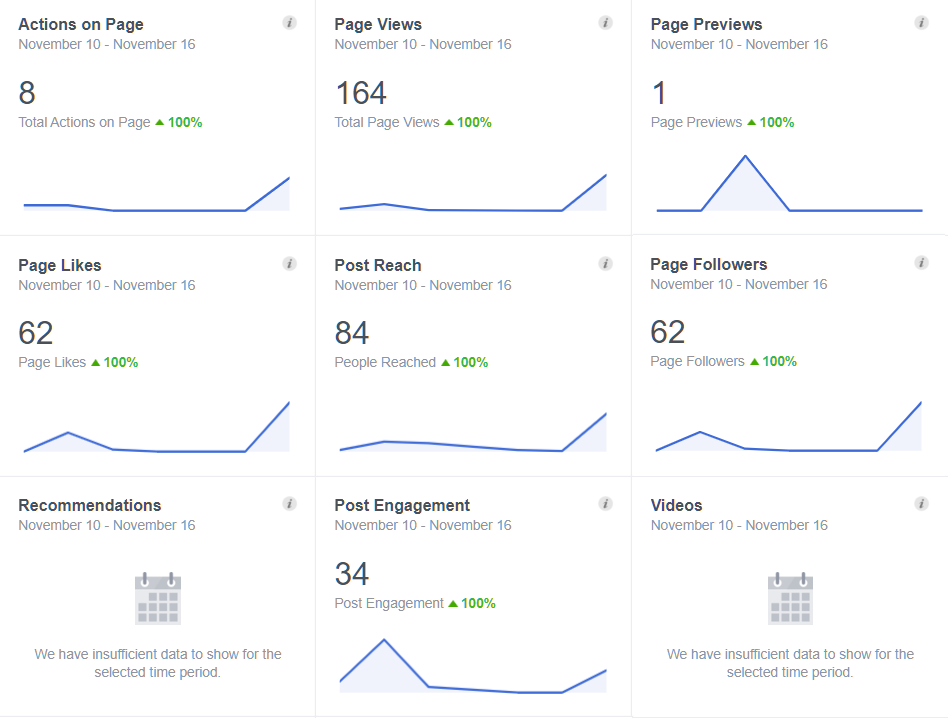
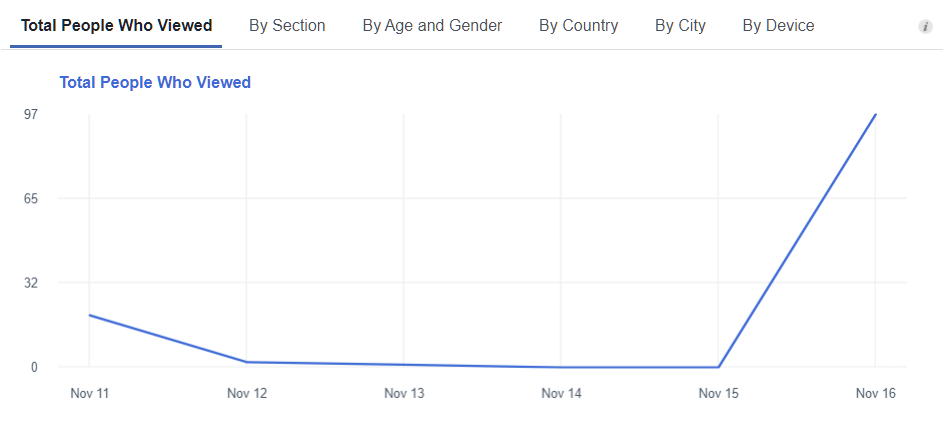
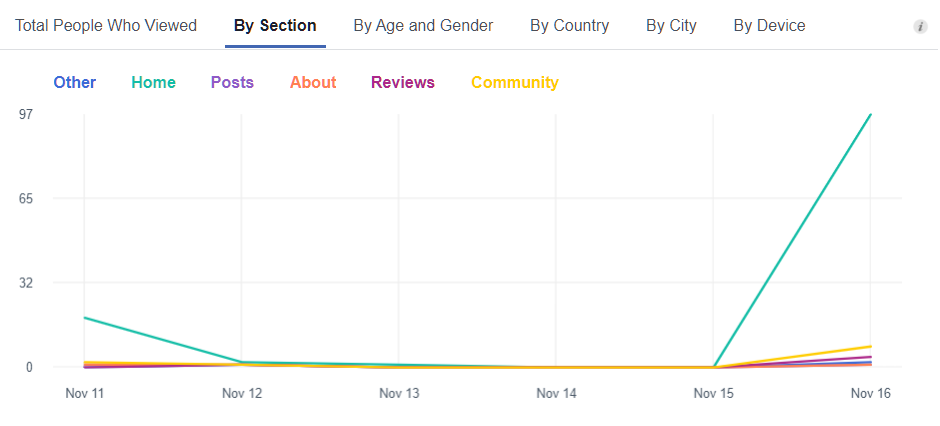
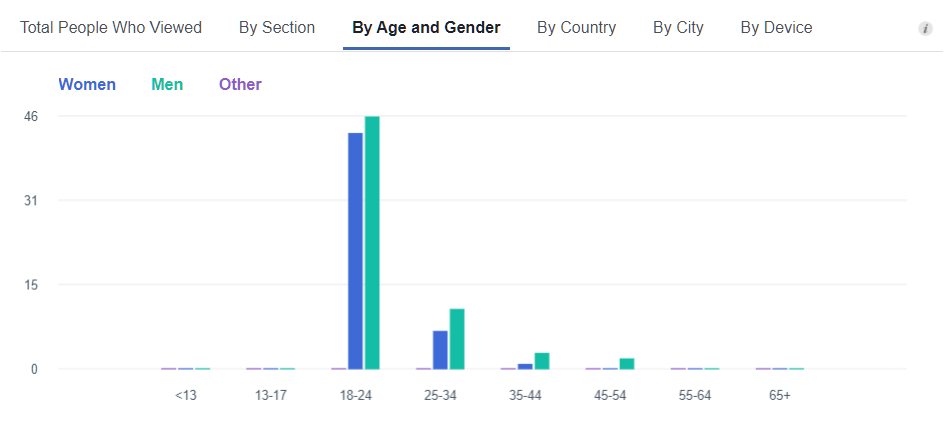
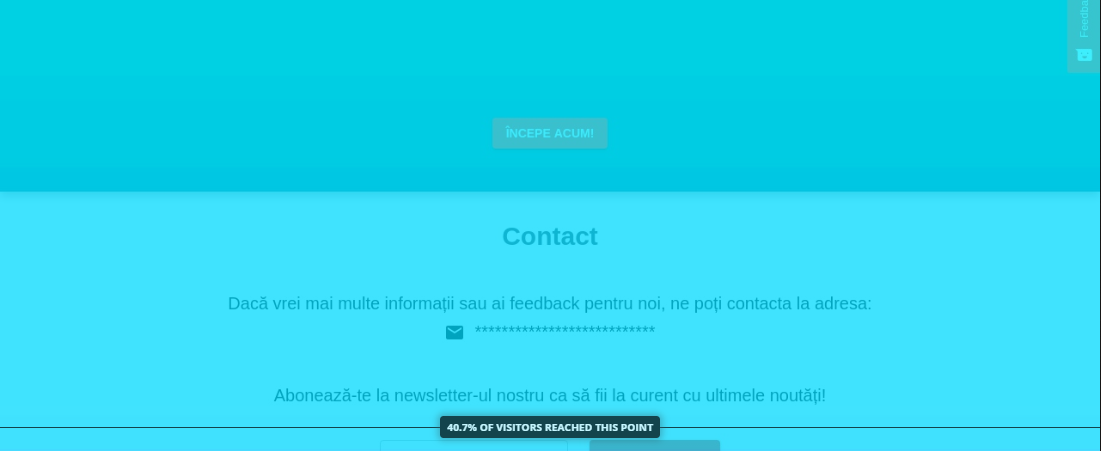
  • We added Hotjar and Google Analytics
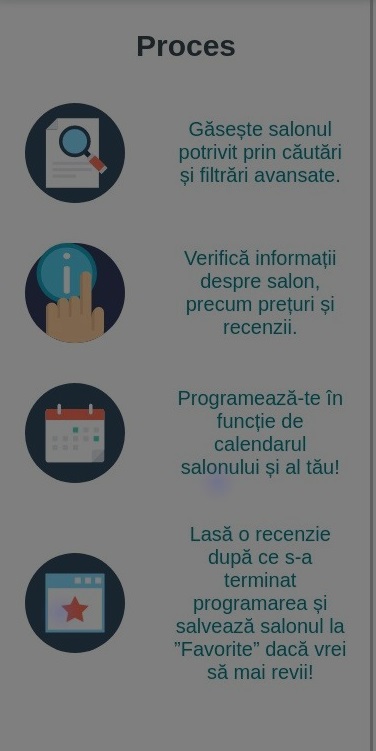
The following image shows the main changes of the landing page marked with yellow.

Promoting the landing page

To bring people to our landing page we used several approaches.
We just mention them, as we will do a more detailed analysis of each method below.

  • We created a Facebook page and invited our friends to like it. You can find our page here.
  • We posted about our page on different Facebook groups and our Facebook profiles.
  • We posted about our page on our LinkedIn profiles.
  • We sent e-mails to all people who gave us their e-mail addresses in the form shared for milestone 2.

Promoting PlanInsta on Facebook

Beside the Facebook Page that was mentioned earlier, we shared the landing page on our profiles, in university groups and in groups about entrepreneurship and startups.
Using this method we reached about 380 people (check last image below). Also, by sharing the page in entrepreneurship and startups we also received feedback, questions and some feature ideas which will be used in the future.
You can find a part of our shares below:
(Use the arrows to navigate between the images)


Promoting PlanInsta on LinkedIn

Because sharing the form for milestone 2 on LinkedIn reached many people, we decided to post again about. Our post reached 291 people, but only 11 people visited our landing page using this method (check last image below).
We can find the proof below:
(Use the arrows to navigate between the images)

Promoting PlanInsta by e-mail

During milestone 2, we asked people to provide us with their e-mail address if they want to be notified when our new platform with online appointments to beauty and wellness centers will be out. We obtained e-mails from 55 potential clients and 12 salon representatives and during this milestone, we sent them e-mails to encourage them to visit our landing page.

Because we had problems before (see milestone 2 when we had our e-mail address blocked by Google), this time we sent the e-mails more carrefully. Also, we used an extension, mailtrack, which allowed us to see how many emails were read by the recipients:
out of 62 emails sent, 18 have been read so far and 15 of them have accessed the page (check last image below).

You can find the proof below:

Analyzing the traffic using Google Analytics

We started to share our landing page starting with 11 November and the following analysis will be made for the period 11 - 17 November. Below is represented the number of visits in each day of the week:
As we can see the most views were Tuesday and Wednesday, 12 and 13 November, days where the landing page was shared in the facebook groups mentioned before.

In order to check the origin of each visit, we created different URLs for the following: Facebook, LinkedIn and Gmail.
These kind of visits are represented by the "Other" category in the following images.
These presents how many visits we succeded to obtain by different methods:
Because the most views comes from "Other", we present this category more detailed below. We can see that the most views have Facebook as origin and then LinkedIn and Gmail at a considerable difference.
Next, we will focus on the people who visited our landing page and their behavior. As we can see in the image below, there were about 500 visits. Also, about 40 people revisited our landing page and on average a visit lasted for about 1 minute and 23 seconds.
The origin of our visits are shown below. We can notice that the traffic came from 24 countries, due to having LinkedIn connections outside of Romania and members from Facebook groups who don't live in Romania.
(Use the arrows to navigate between images)
Because most of the traffic comes from Romania, we now present the distribution of visits within our country. (Use the arrows to navigate between images)
Here you can find more details about the systems used by the visitors of our landing page. This information can be really useful during development because as we can see almost 61% reached our landing page using mobile phones. In addition, the difference between Android and iOs is small and 6 of the most used 10 mobile phones used by our visitors are IPhones , so it confirms again the fact that we need an website which is responsive and also an application for both Android and iOs.
(Use the arrows to navigate between images)
The behaviour of the user is represented in the image below. As we can see a large number of people are only accessing the main page of the landing page and only a few navigate to the business page.

Analyzing the traffic using HotJar

Next we will present the results we obtained with HotJar. Using this, we analyzed the heatmaps to see how people interact with our landing page and also scroll maps to check if they read the entire page.
Also, we received 4 feedbacks from the users. You can find them below together with more session details.

Feedback


Scroll Maps

The tabels below contain the percentage of visitors who scrolled until each of the sections of the page for the main page of our landing page. We can also find the scroll maps here: desktop version and mobile version .

Desktop Version

Section Percentage
Presentation 75%
Solution 56,3%
Process 53,3%
Advantages 49,6%
Contact 47%

Mobile Version

Section Percentage
Presentation 75%
Solution 64,2%
Process 59,3%
Advantages 52,2%
Contact 45,1%

Heat Maps

Next, we will present the heat map for the main page of our landing page and also for the page which announces that PlanInsta is not ready yet and that we are still working.
Heat maps for the desktop version of the main page of the landing page
(Use the arrows to see the heat map for each section)
Heat maps for the mobile version of the main page of the landing page
(Use the arrows to see the heat map for each section)
Heat maps for the "Work in progress" page
(Use the arrows to see the heat map for desktop and mobile versions)

Analyzing the Facebook Page

Our Facebook page was lauched on 9 November 2019 and since then we succeded to have 98 followers by inviting our friends and asking them to also invite other people.
We posted 4 times this week and each of our posts reached about 100 people as you can see below.
Below you can find a part of the analysis provided by Facebook for our page, mostly about likes and our followers.
(Use the arrows to navigate between the images)

Analyzing the Youtube traffic

To check how many people saw our video presentation , we use the analysis provided by Youtube Studio. You can find a part of this analysis below.
(Use the arrows to navigate between the images)
As we can see, the video had 183 views and people watched on average 38 seconds and only 40% watched it until the end.
Also, about 61% from the views are coming from our landing page and 4,2% from the Facebook post.

Conversion Rate

Before starting to share the landing page, we set the following goals from our users: we wanted to read as much of the content of our page and then to subscribe to our newsletter and to press the button "Get started".

Using HotJar we noticed that people spend time reading the content of the landing page as 40% reached the bottom of the page.
Regarding the "Get started" button, almost 40 people clicked it on the mobile version and 10 people on the desktop version.
Furthermore, our landing page convinced 18 people to subscribe to our newsletter. Due to the privacy reason, we are not posting their e-mails here, but we can provide them on request if necessary.

Conclusions

We shared the landing page during 7 days (11-17 November 2019) on different platforms and we succeded to reach 500 people from different countries, the most important one being Romania. Also, we concluded that Facebook was the best platform in our case because almost 400 from the total views had this origin (shares on Facebook Groups or our official Facebook page).

Using HotJar, we concluded that people were interested in findind more about PlanInsta because about 40% reached the end of the page and also the maximum interest is represented by the subscription which is not very high, but this may be due to the fact that nowadays many of us do not want to receive promotional messages even if we are interested in something, but we prefer to check again ourselves.

PlanInsta Team

Ovidiu Dăncilă
ovidiu.dancila@gmail.com
Back-End Developer
Andrei Lecu
andreilecu07@gmail.com
Back-End Developer
Vlad Ilie
ilievlad73@gmail.com
Front-End Developer
Andreea Georgian
andreea18nov1996@gmail.com
Front-End Developer
Vlad Ștefănescu
vlad.a.stefanescu@gmail.com
Front-End Developer
Cristian Popa
cristian.viorel.popa@gmail.com
Data Scientist
Bianca Cauc
cauc.bianca@gmail.com
Project Manager
office.planinsta@gmail.com
Bucharest, Romania
Copyright © All rights reserved